| Ayee : Products |
| Products | Company | Service | Contact | Demo | Imprint | ||||||
| Sign up now... | ||
 | ||
| ...and test 30 days for free | ||
| Customer's Items | ||
 | ||
| Access code | ||
 | ||
| Enter your access code here | ||
| Products | |
| Gallery | |
| "Light" |

|
| "Limited 100" |
|
| "Unlimited" |
|
| Bundle II |
|
| Bundle II plus |
|
| Language | |
| This Page in | |
| Deutsch |
|
| English |
|
| Français |
|
Ayee Watcher: the efficient analysis tool
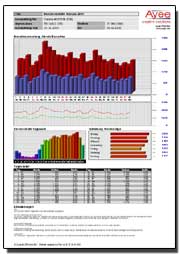
The Ayee Watcher is a convenient, comfortable and efficient analysis tool, which our customers asked for and proves the success of the Ayee Gallery. With this tool, information about customer potential, unused up to this point, is pointed out and represented in very clear, meaningful and multidimensional diagrams.
The Ayee Watcher can be used as a stand-alone tool or bundled with your Ayee Gallery.
The bundle comes with a money-back guarantee.
If you are not successful after one month, despite following our guidelines, your money will be returned to you.
How is success measured?
It is necessary to exhaust your unused customer potential by increasing the ratio of visitors to site visits. This means the visitor has been made aware of your additional products. The counting criterion is multiple site visits by the same user. If the monthly average factor is grater than 2, then the success is proven. If the monthly average factor is smaller than 2, then the money back guarantee takes effect.
Which defaults need to be kept?
- The placement of the Ayee gallery in direct spatial proximity to your highest product illustration.
- The occasional alteration of the appearance of your Ayee gallery, similar to the change of decoration in a shop window. Here pre-existing templates are very useful.

Monthly evaluation of visitor/site visits
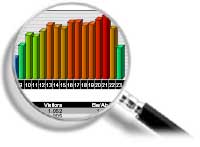
Both diagrams show the relationship of the visits (Impressions) to the visitors (Visitors). The vertical scale indicates the number of the site visits. The horizontal scale shows the current calendar days. The further the curves in the lower diagram move away from each other, the more frequently the same visitor visits your site.
Both diagrams show the relationship of the visits (Impressions) to the visitors (Visitors). The vertical scale indicates the number of the site visits. The horizontal scale shows the current calendar days. The further the curves in the lower diagram move away from each other, the more frequently the same visitor visits your site.
Average time of day
Here you can see with one glance the average time of day the most visits to your site occur.
Here you can see with one glance the average time of day the most visits to your site occur.
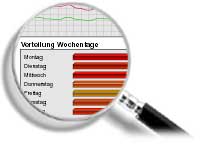
Distribution by days of the week
Through the distribution of site visits by days of the week, you know when your busiest day is. On the right side the total site visits are displayed for the week day in cumulative fashion. With the help of the information supplied by the Watcher you can optimize your sales strategies. In this way you will increase your revenue.
This is exactly our objective for you "increase sales"!
| Watcher & Galerie | Limited 100 | Unlimited | Watcher |
|---|---|---|---|
| Screenshot |  |  |  |
| Price/Month (monthly billed) | 8,50 € | 17,70 € | 4,90 € |
| Price/Month (billed for 6 months) | 7,00 € | 14,00 € | 4,10 |
| Price/Month (billed for 1 year) | 6,35 € | 11,94 € | 3,69 € |